25
Jun
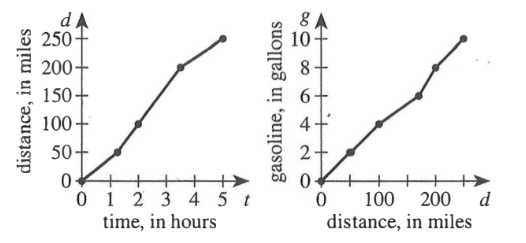
The 2 graphs shown below represent a car trip. The graph on the left shows the total distance as a function of time. The graph on the right shows the total number of gallons of gasoline used as a function of the total distance. Approximately how many gallons of gasoline were used during the first 2 hours of the trip?